Sioux Falls Market Report: August 2026
Median prices, inventory, days on market, and what the latest numbers mean for your next move.
This is the August 2026 Sioux Falls market report: the latest numbers from the Realtor Association of the Sioux Empire (RASE), what moved in August, and what it means for buyers and sellers across the metro. I'm Jennifer Krosch, a Realtor with eXp Realty in Sioux Falls, and I read these reports the way I walk homes: looking for what is solid, what is soft, and what actually matters to your next move.
About these numbers
Data current as of September 1, 2026, from the Realtor Association of the Sioux Empire Multiple Listing Service (RASE) via ShowingTime Plus; national figures from the National Association of REALTORS.
A note on reading monthly data: activity can sometimes look extreme due to small sample sizes, and these figures do not account for prior listing contracts or seller concessions. One month rarely tells the whole story, so I read August's numbers alongside the year-to-date trends below.
National Context
The national housing market cooled a little more in August. Existing-home sales edged down 1.7% month over month to a seasonally adjusted annual rate of 4.06 million units, with increases in the Northeast and flat sales in the West offset by declines in the Midwest and South. Compared with a year earlier, sales rose in the Midwest and West and were flat in the Northeast and South. The national median existing-home sales price climbed to $431,400, and inventory sits at a 4.6-month supply. Year-to-date sales are up 2.4%.
The pace is also slowing: homes are sitting on the market longer, and fewer buyers are bidding above asking than a year earlier. NAR pending home sales fell 2.2% year over year in July to the lowest level since January 2026, roughly 30% below the pre-pandemic 2019 level even as payroll employment runs about 5% above it. The national story is a market that has slowed without falling over, which is exactly why the local numbers below are worth reading closely.
Sioux Falls at a Glance
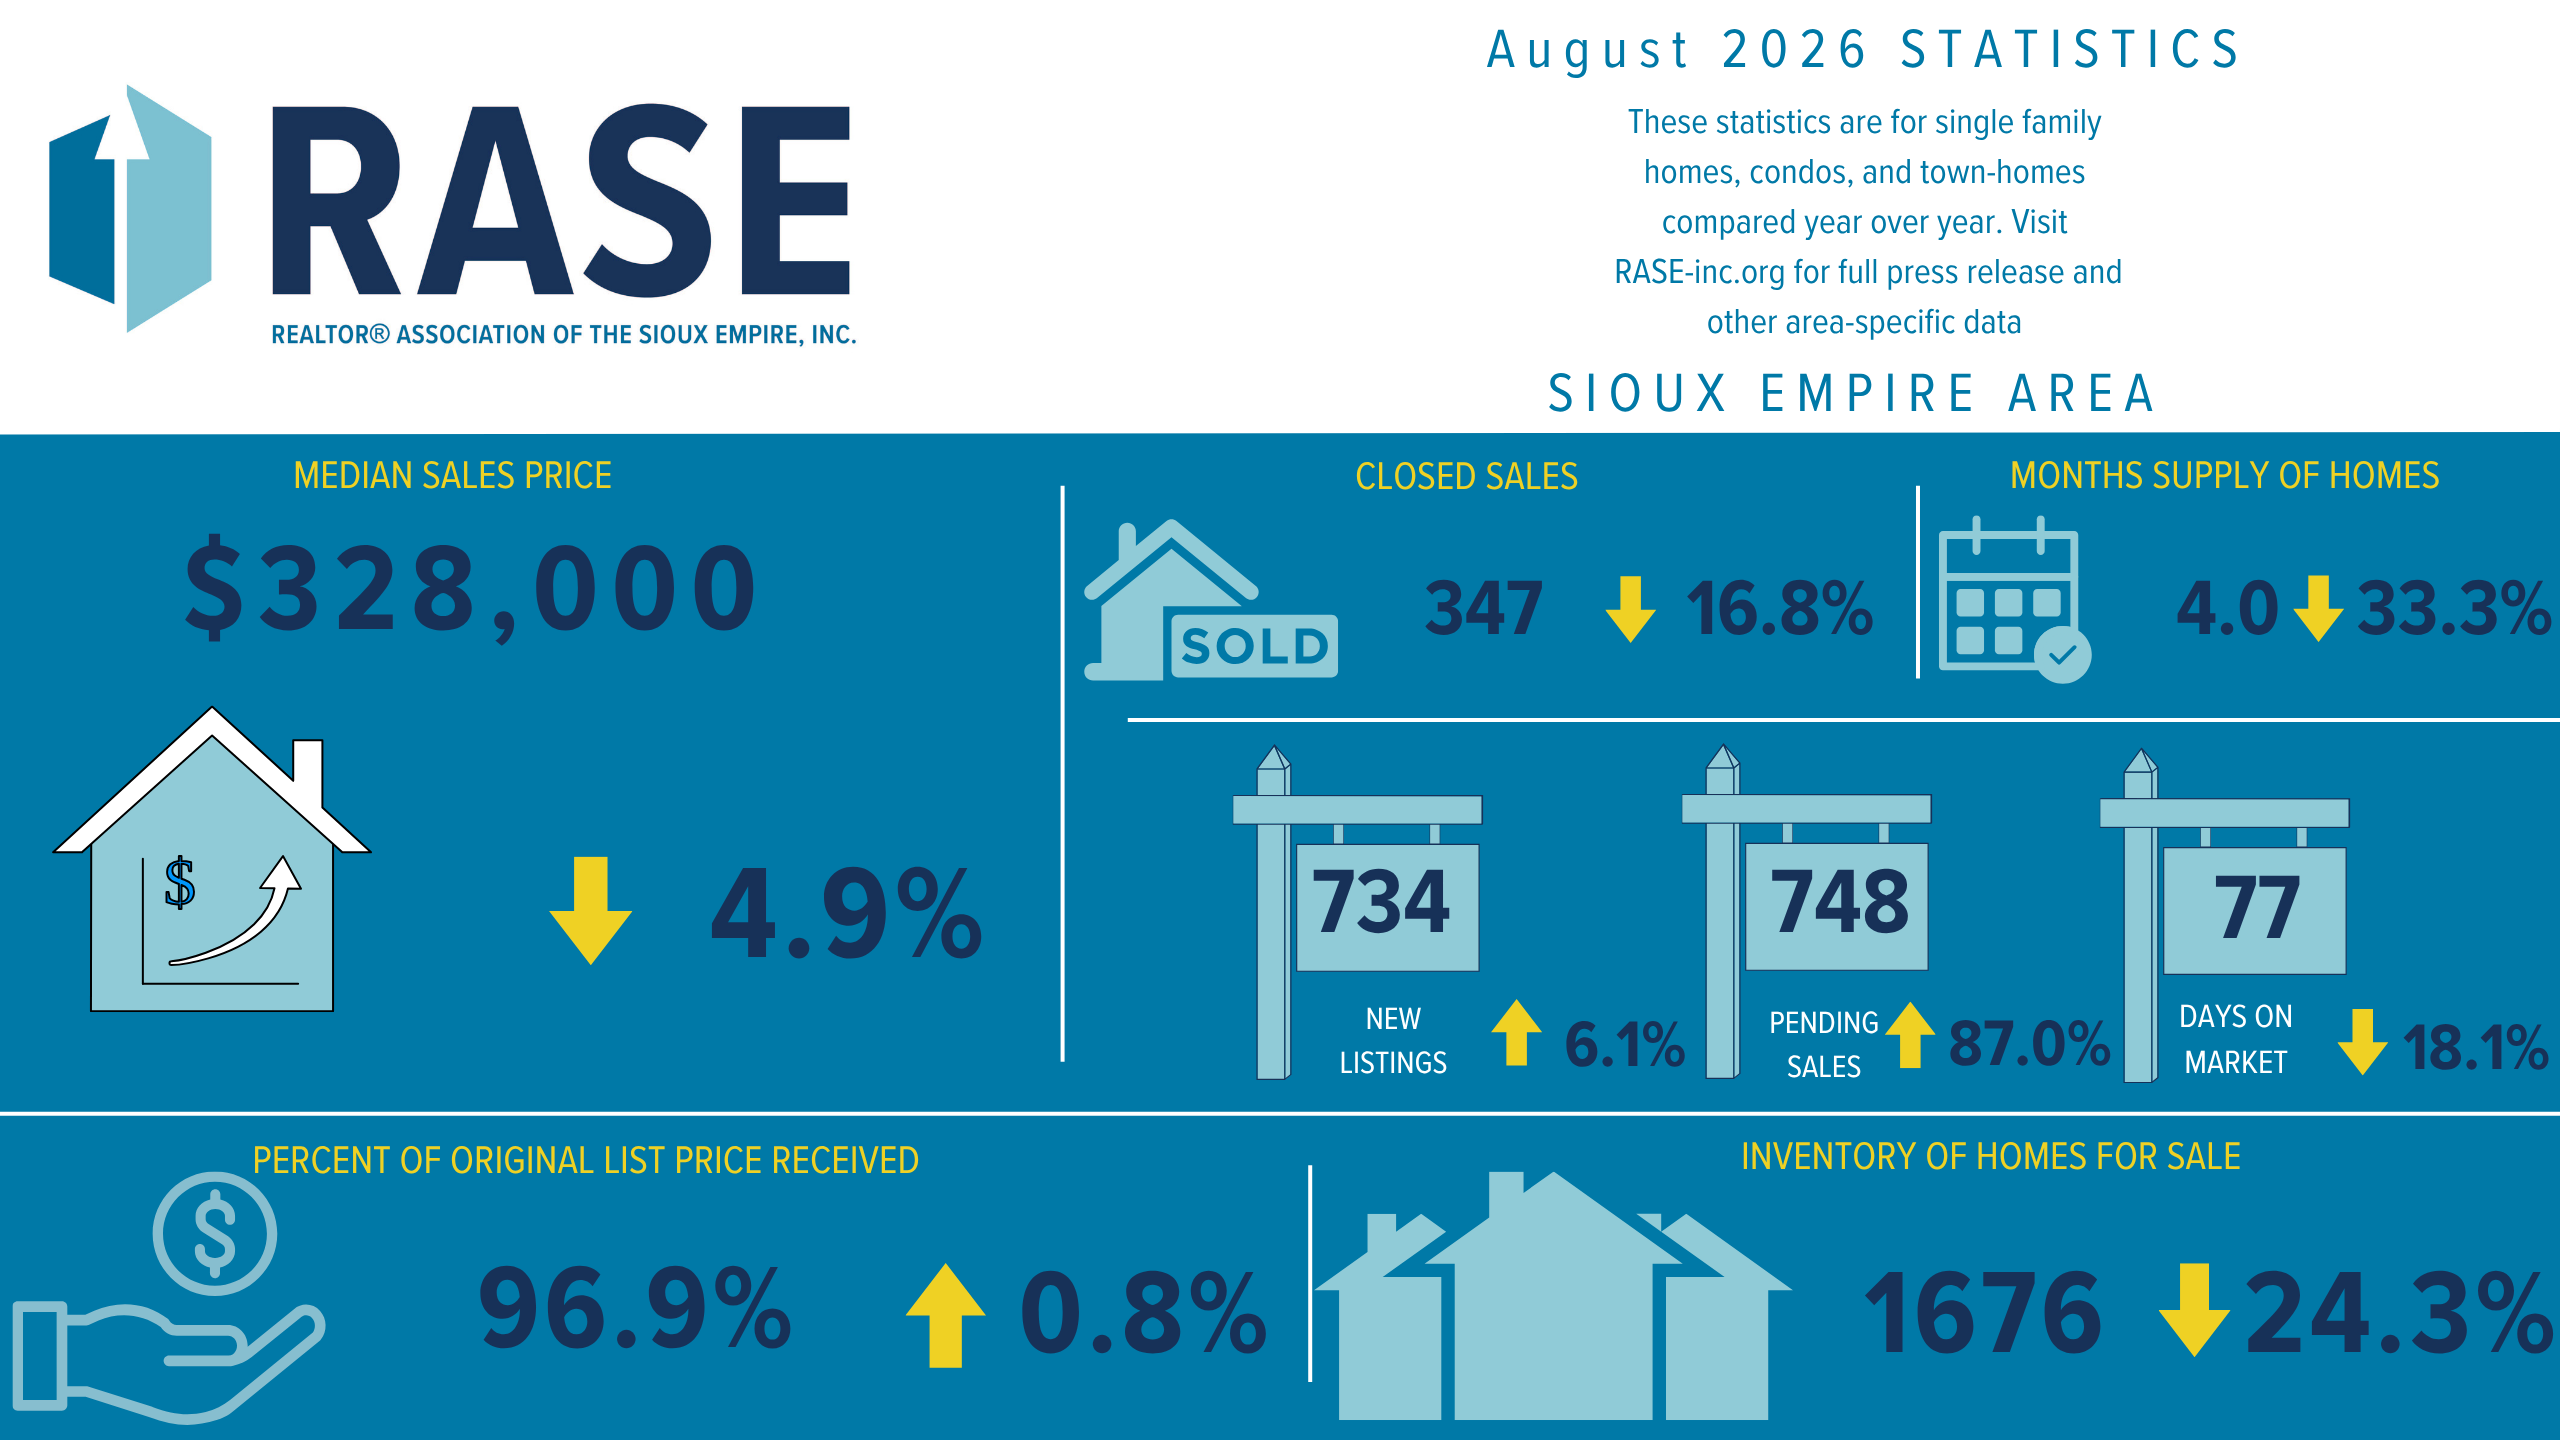
Here is what the August data showed across the Sioux Falls region (RASE Monthly Market Indicators):
- New listings: 734, up 6.1%.
- Pending sales: 748, up 87.0%. The report flags that pending statistics may be elevated due to RESO reporting practice changes, so treat this number cautiously.
- Closed sales: 347, down 16.8%.
- Inventory: 1,676 homes, down 24.3%.
- Months supply of inventory: 4.0, down 33.3%.
- Median sales price: $328,000, down 4.9% from $344,900 a year earlier.
- Average sales price: $367,481, down 5.2%.
- Days on market: 77, down 18.1%.
- Percent of original list price received: 96.9%, up 0.8%.
- Housing affordability index: 117, up 4.5%.
Year to date through August 2026, the region's median sales price is $335,000, up 3.1%; new listings are at 5,660, up 0.9%; pending sales at 3,609, up 20.1%; closed sales at 2,973, down 1.9%; the average sales price is $387,896, up 5.4%; and days on market run 93, up 1.1%. In one sentence: fewer closings, but the homes that did sell moved faster and for close to asking.
The Metro: Lincoln and Minnehaha Counties
For the Sioux Falls metro, August brought 624 new listings, up 7.4%; 291 closed sales, down 15.7%; a median sales price of $330,000, down 8.3%; an average sales price of $377,507, down 7.4%; 75 days on market, down 18.5%; inventory of 1,313 homes, down 26.1%; and 3.7 months supply, down 35.1%. Year to date, the metro median is $344,000, up 3.0%; the average is $399,725, up 5.2%; new listings are 4,774, up 0.8%; and closed sales are 2,536, down 0.9%.
The City of Sioux Falls
Inside the city limits, August brought 463 new listings, up 7.9%; 225 closed sales, down 12.5%; a median sales price of $329,500, down 5.3%; an average sales price of $363,096, down 8.4%; 76 days on market, down 12.6%; inventory of 976 homes, down 24.1%; and 3.7 months supply, down 32.7%. The year-to-date median for the city is $334,900, up 3.0%.
Housing Supply & Segments
The RASE Housing Supply Overview looks at the 12-month span from September 2025 through August 2026, which smooths out the month-to-month noise:
- Pending sales in the Sioux Falls region were up 12.2% overall, from 4,439 to 4,980.
- Largest price-range gain: the $700,000 to $800,000 range, up 56.8%.
- Median sales price up 2.2% to $330,000 over the span.
- New construction segment prices up 4.6% to $386,900.
- Quickest-selling price range: $150,000 to $200,000 at 83 days.
- Slowest-selling price range: $900,000 to $1 million at 129 days.
- Inventory: market-wide down 24.3%; new construction inventory down 23.5%.
- Months supply: 3.5 months for single-family homes and 6.4 months for condos.
- Pending by segment: previously owned up 11.1%, new construction up 18.5%, single-family detached up 13.3%.
The clearest signal here is in new construction and the move-up ranges. Buyers who want a new home are competing for a smaller pool while prices in that segment keep climbing, and the strongest growth in pending sales is at the top of the move-up market, not the entry level.
What It Means for Buyers & Sellers
Here is my honest read of this report. August had fewer closed sales than a year ago, but the homes that sold absorbed faster, 77 days region-wide and down almost a fifth from last year. That sounds like a contradiction until you remember the other half of the story: inventory is down 24.3%, so there is simply less to choose from, and the homes that are priced right are getting picked up quickly.
Supply is still seller-leaning, especially for single-family homes at 3.5 months of inventory. Anything under about five months usually tilts toward the seller, and 3.5 is tight. That said, prices were roughly flat to soft for the month, with the median down 4.9% to $328,000, while the year-to-date median is up 3.1% at $335,000. One month of a dip does not undo a year of gains, but it does tell sellers that pricing strategy matters more than it did twelve months ago. On average, sellers are receiving 96.9% of their original list price, so a realistic starting price still lands you close to your number, and an aggressive one can cost you showings entirely.
For buyers, the tighter supply means being ready when the right home shows up: pre-approval in hand, your must-haves clear, and someone who can move fast. On the positive side, the market is not as frenzied as it was during the pandemic years. Sellers still average close to two and a half months to sell, there is room to negotiate, and the housing affordability index came in at 117, up 4.5%, which means the median-income household still earns more than it takes to qualify for the median-priced home. That is the practical definition of a workable market.
And the segment story matters for both sides. If you are buying new construction, prices are up 4.6% to $386,900 with inventory down 23.5%, so plan ahead and expect competition. If you are selling in a move-up range, the $700,000 to $800,000 bracket saw pending sales grow 56.8% over the past twelve months, and homes in that range are moving faster than they used to. If you are buying your first home, the $150,000 to $200,000 range is the quickest-selling band in the market at 83 days, which tells you entry-level demand is real and listings do not linger.
My bottom line: this is a healthy, balanced-leaning market with a tight single-family supply. Sellers should price realistically and lean on condition and presentation, and buyers should be organized and ready rather than waiting for a market-wide collapse that the data does not show coming. If you would like to talk through what these numbers mean for your specific home or search, reach out any time. That is what I am here for.
FAQ: August 2026 Sioux Falls Market
What was the median home price in Sioux Falls in August 2026?
The median sales price across the Sioux Falls region was $328,000 in August 2026, down 4.9% from $344,900 a year earlier. The metro (Lincoln and Minnehaha counties) came in at $330,000 and the city of Sioux Falls at $329,500. Year to date, the regional median is $335,000, up 3.1%.
Is it a buyer's or seller's market right now?
Supply still leans toward sellers, especially for single-family homes. Inventory was down 24.3% year over year to 1,676 homes, with 4.0 months of supply region-wide and just 3.5 months for single-family homes. At the same time, prices were flat to slightly soft for the month and sellers received about 96.9% of original list price on average, so buyers do have room to negotiate.
How fast are homes selling in Sioux Falls?
The average was 77 days on market region-wide in August 2026, down 18.1% from a year earlier. The metro averaged 75 days and the city of Sioux Falls 76 days. Over the 12 months through August, the quickest-selling price range was $150,000 to $200,000 at 83 days, and the slowest was $900,000 to $1 million at 129 days.
Why did pending sales jump 87%?
Pending sales came in at 748, up 87.0% from a year earlier, but the report itself flags the figure with caution: pending statistics may be elevated due to RESO reporting practice changes. Treat the big jump as likely a reporting change rather than a sudden surge in contracts.
What's happening with new construction?
New construction remains a strength. Over the 12-month span through August 2026, new construction segment prices were up 4.6% to $386,900, pending sales in new construction were up 18.5%, and new construction inventory was down 23.5%. Region-wide new listings were up 6.1% in August, a bit of fresh supply for buyers to watch.
What price range is selling fastest in Sioux Falls?
Over the 12 months through August, the quickest-selling price range was $150,000 to $200,000 at an average of 83 days, followed by the broader market at roughly 75 to 77 days in August. The slowest range was $900,000 to $1 million at 129 days, and the $700,000 to $800,000 range saw the largest gain in pending sales, up 56.8%.